
Learn More about our other offerings:
Biosearch Technologies Oligo Synthesis
|
Lucigen Reagent Components
|
Rapid Genomics Genotyping Solutions
|
SeraCare
Our KlusterCaller™ software is a standalone version of the genotyping data analysis and reporting module that is built in to our Kraken™ workflow management software. When dual emission genotyping data from a fluorescent reader is imported into the KlusterCaller software, a traditional cluster graph for each assay is automatically generated. Proprietary algorithms built into the software automatically discern if the assay results are homozygous for allele 1, homozygous for allele 2, heterozygous, or inconclusive.
KlusterCaller has the ability to import, display, and export data in 96-, 384-, and 1536-well plate formats.
For each KlusterCaller project, a project tree will be created on the left hand side of the window (see Figure 1). This will detail
all master DNA plates within the project, the assays within the project, and the genotyping cluster plots (within the ‘Calls’ section).
Within a DNA master plate map, individual wells can be identified as DNA samples, no template controls (NTC), or empty.
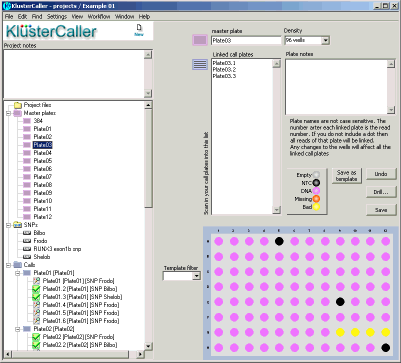
Figure 1. KlusterCaller project window. The project tree can be used to navigate to detailed information about DNA master plates, the assays within
the project, and the genotyping call results.
Genotyping data that is imported into a KlusterCaller project will be displayed as a Cartesian cluster plot (see Figure 2). FAM values
are plotted on the X axis and HEX values are plotted on the Y axis. Normalisation of results using ROX (passive reference dye) can be
switched on or off manually.
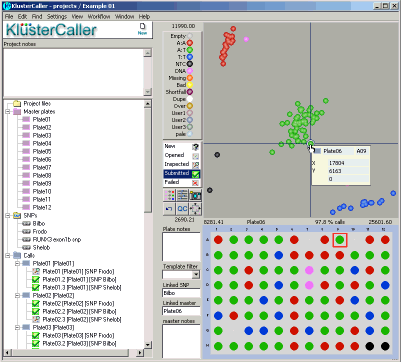
Figure 2. KlusterCaller genotyping results. The genotyping results are displayed in a cluster plot. Blue data points are homozygous for the allele reported by FAM, green
data points are heterozygous and red data points are homozygous for the allele reported by HEX. The black data points represent the no template controls (NTC) and
pink data points are unconfirmed. The DNA sample plate layout is shown below the cluster plot.
| Europe, Middle East, and Africa | |
|---|---|
| UK | +44 1992 470 757 |
| Germany | +49 30 1663 54600 |
| North America, Latin America | |
| Wisconsin, USA | +1 888 575 9695 |
| Asia Pacific | |
| China | +8621-22509000 |
| Singapore | +65 6734 4800 |